Publisher Widget and Domain Performance Graphs Support
The Publisher Performance Graph allows you to view your individual widget performance or account performance by comparing any two data points against each other over any date range.
Data points include Impressions, Clicks, CTR%, Ad CPC, Ad RPM and Ad Revenue. You can also filter by device type for the most detailed reporting.
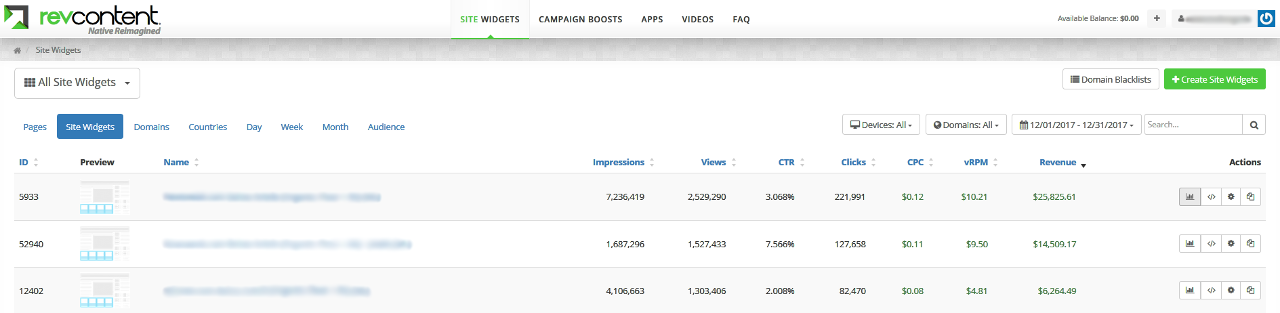
To view Widget Performance, select the graph icon.
In the Overview tab, select the graph icon to see a graph of this widget’s overall performance.
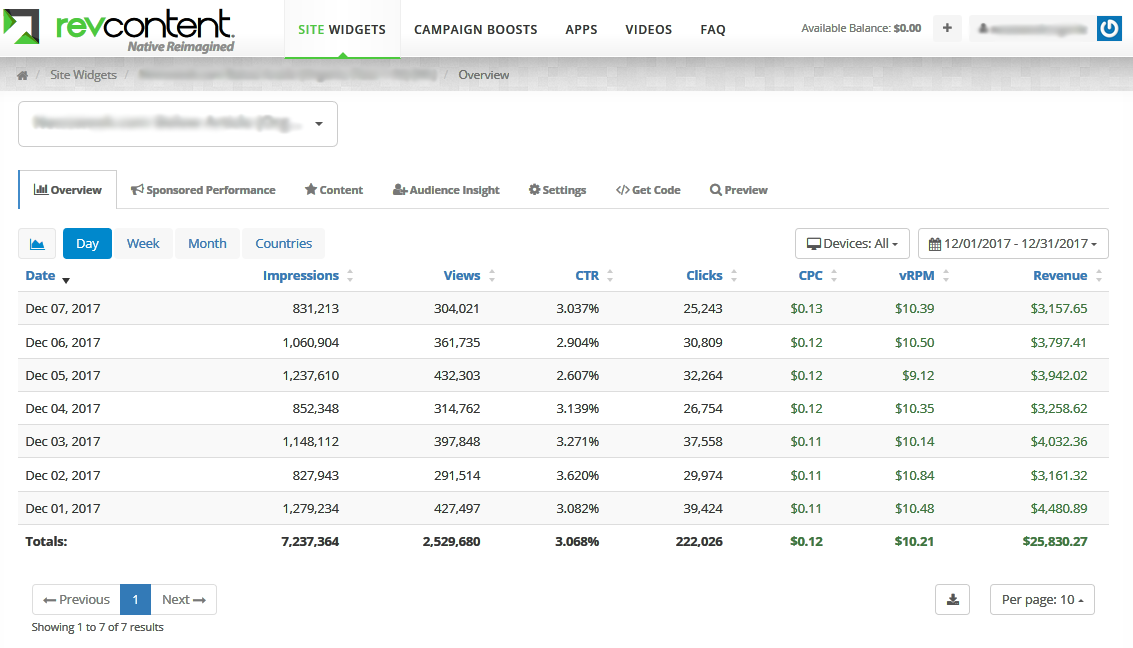
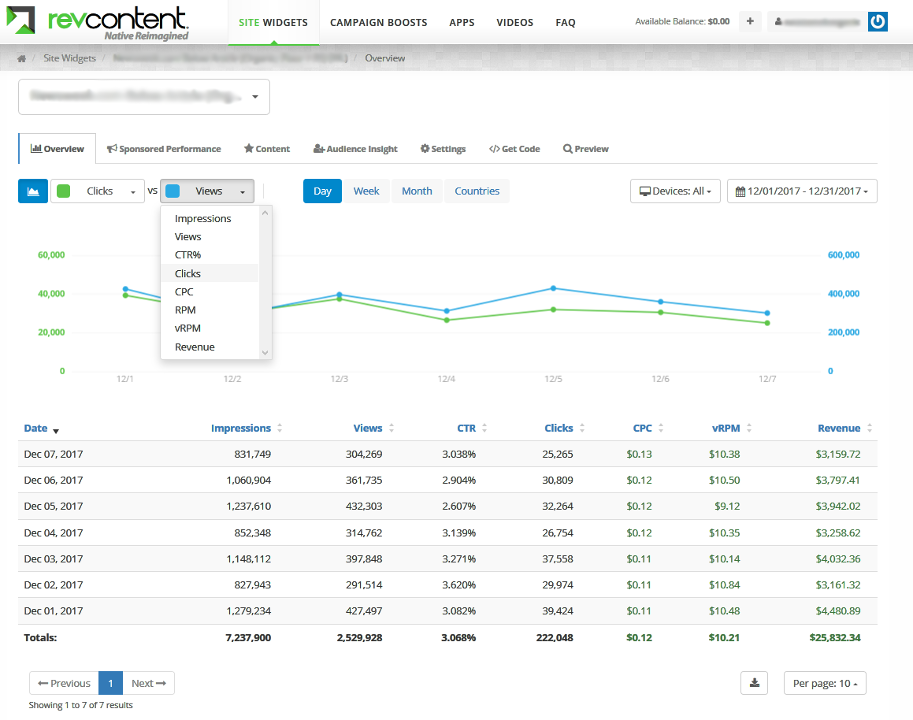
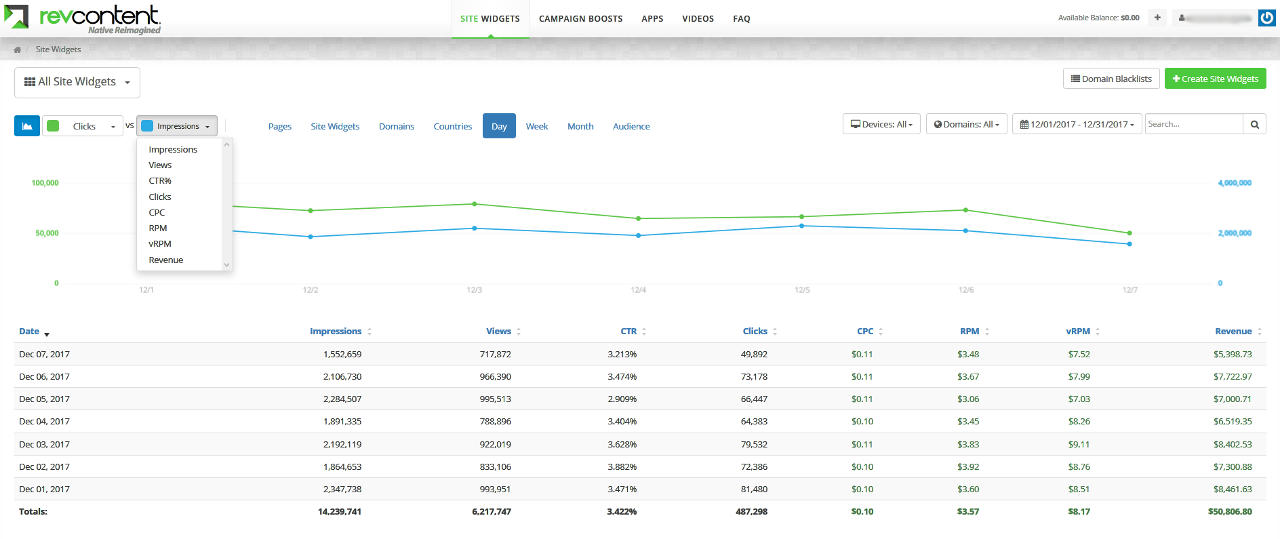
Compare any two data points against each other by selecting from the drop down list. Data points include Impressions, Clicks, CTR, Views, CPC, RPM, vRPM, Revenue, and more.
Both Y Axes are on either side of the graph.
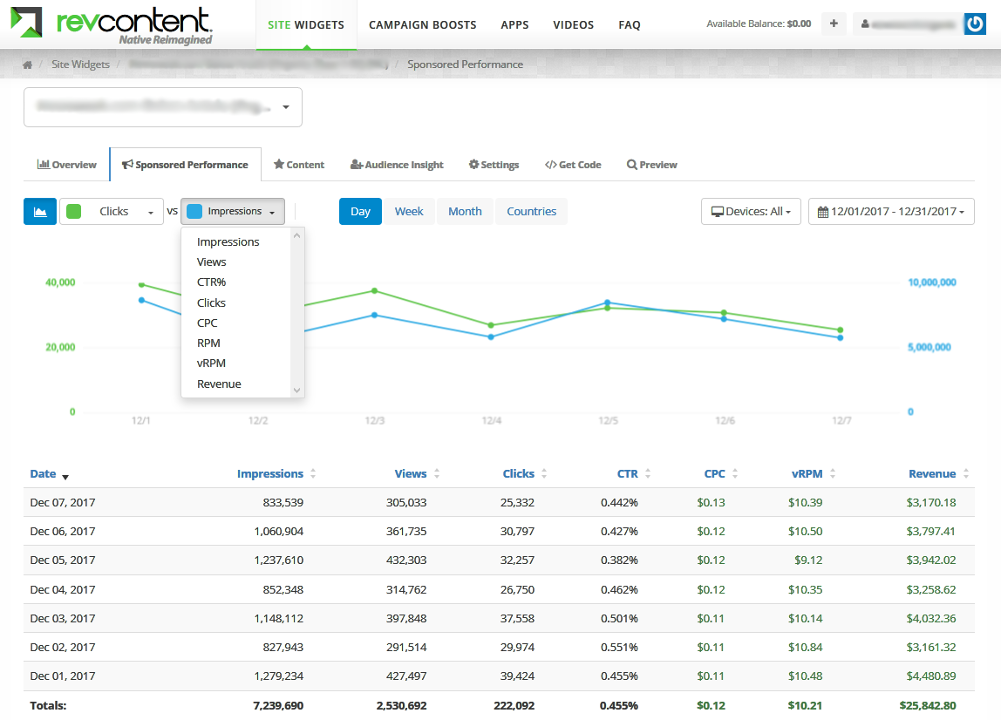
A graph of this widget’s Sponsored Performance is available under the Sponsored Performance tab.
To view Account Performance, select Domains, Countries, Day, Week, Month, or Audience on your Site Widgets homepage.

Select the graph icon to see a graph of the account’s overall performance.
Did this answer your question?